Dynamic study of public transport networks
Initially developed for companies managing public transport networks, UrbaSim has become an autonomous application, usable by public transport operators as well as by consultants who carry out studies for them.
Urbasim allows to describe a network of metros, buses, trams, or a combination of vehicles, and to test its operation, either to discover points of improvement in daily use, or to see the responsiveness to special events (football match, clearance sale, holidays), or to test future changes in real conditions (new stop, modified schedules, different capacity of new rolling stock, variation in passenger demand, etc.).
Load Capacity Graph >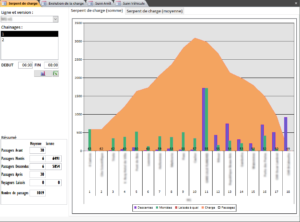
- Service quality indicators: number of people left at the dock, waiting times, level of comfort in vehicles.
- Resource use indicators: number of trips or kilometers, vehicle filling rate, crowds on the docks.
- Tracking graphics for a particular line vehicle, or for a specific stop.
- Load evolution graph, Load Capacity graph.
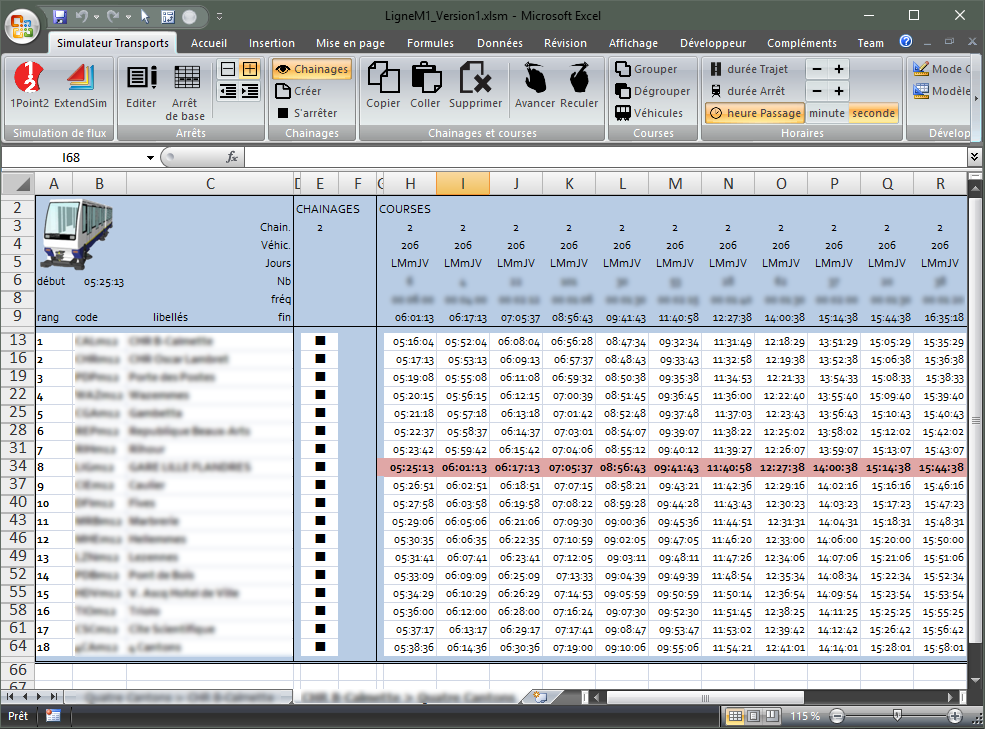
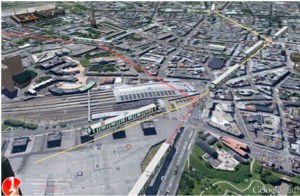 The user interface relies on both MS Excel and MS Access to facilitate data entry and retrieval. Each simulation can be played on a Google Earth map, combining the realism of the rendering and the intuitive consideration of congestion or blockage phenomena.
< Simulation in Google Earth
Among our customers on similar projects: Keolis – Tisséo

